| Author: | g1eb |
|---|---|
| Official Page: | Go to website |
| Publish Date: | March 29, 2016 |
| License: | MIT |
Description:
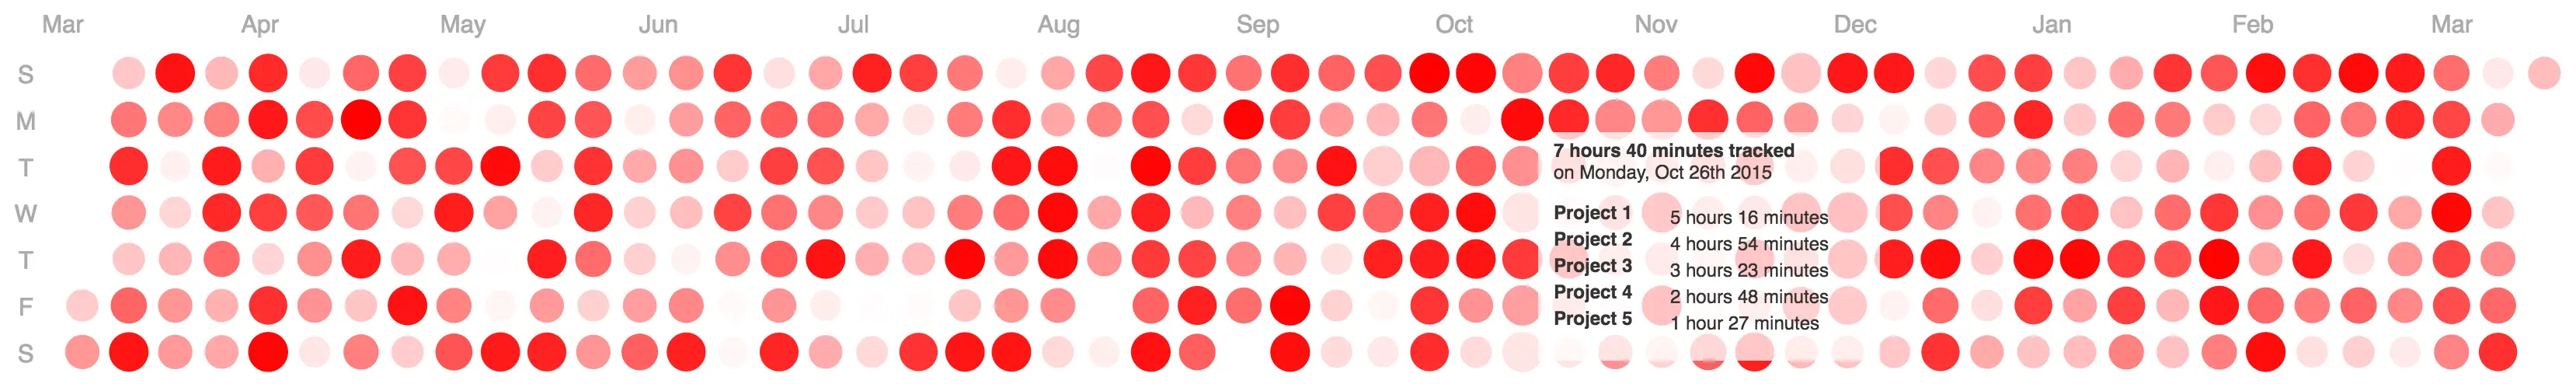
This d3.js heatmap representing time series data is used to visualize tracked time over the past year, showing details for each of the days on demand.
| Author: | g1eb |
|---|---|
| Official Page: | Go to website |
| Publish Date: | March 29, 2016 |
| License: | MIT |
This d3.js heatmap representing time series data is used to visualize tracked time over the past year, showing details for each of the days on demand.