| Author: | GordyD |
|---|---|
| Official Page: | Go to website |
| Publish Date: | November 25, 2014 |
| License: | MIT |
Description:
An Angular.js directive for creating customizable, animated and interactive radial plots (radar graphs) powered by D3.js.
Previews:
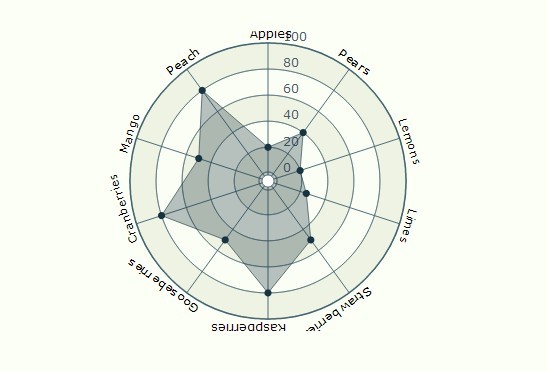
Angular Radial Plot Basic Demo
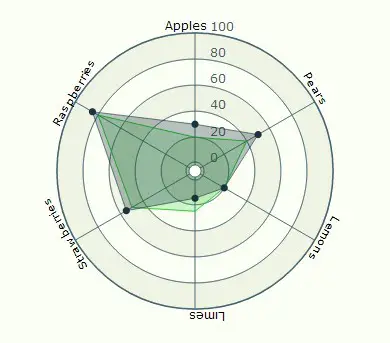
Angular Radial Plot Comparison Demo
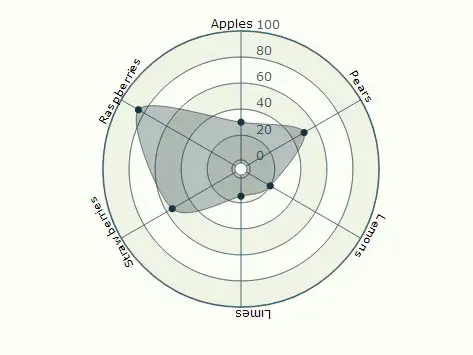
Angular Radial Plot Rounded Area Demo