| Author: | swimlane |
|---|---|
| Official Page: | Go to website |
| Publish Date: | November 24, 2017 |
| License: | MIT |
Description:
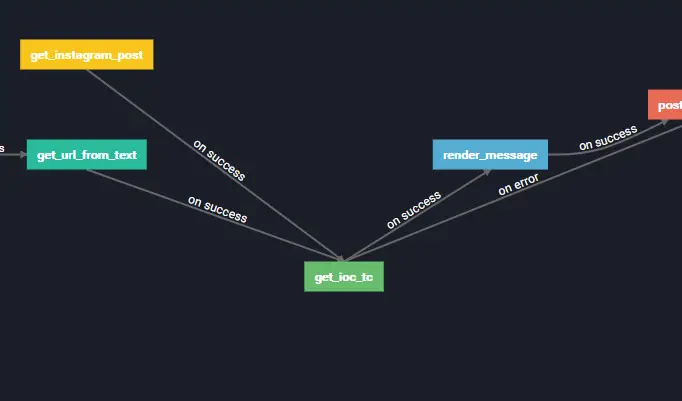
A Directed Acyclic Graph (DAG) visualization for Angular 4+, implemented using ngx-charts.
Installation:
# NPM
$ npm install @swimlane/ngx-charts-dag --save
Usage:
<ngx-charts-directed-graph
  class="chart-container"
  [view]="view"
  [legend]="showLegend"
  [links]="hierarchialGraph.links"
  (legendLabelClick)="onLegendLabelClick($event)"
  [nodes]="hierarchialGraph.nodes"
  [scheme]="colorScheme"
  [orientation]="orientation"
  [curve]="curve"
  (select)="select($event)">

  <template #defsTemplate>
    <svg:marker id="arrow" viewBox="0 -5 10 10" refX="8" refY="0" markerWidth="4" markerHeight="4" orient="auto">
      <svg:path d="M0,-5L10,0L0,5" class="arrow-head" />
    </svg:marker>
  </template>

  <template #nodeTemplate let-node>
    <svg:g class="node"
      ngx-tooltip
      [tooltipPlacement]="'top'"
      [tooltipType]="'tooltip'"
      [tooltipTitle]="node.label">
      <svg:rect [attr.width]="node.width" [attr.height]="node.height" [attr.fill]="node.options.color" />
      <svg:text alignment-baseline="central" [attr.x]="10" [attr.y]="node.height / 2">{{node.label}}</svg:text>
    </svg:g>
  </template>

  <template #linkTemplate let-link>
    <svg:g class="edge">
      <svg:path
        stroke-width="2"
        marker-end="url(#arrow)" >
      </svg:path>
    </svg:g>
  </template>

</ngx-charts-directed-graph>